models_rq1<-data_rq1%>%group_by(perception)%>%nest%>%mutate(# Models with all covariates included mod_full =map(data,~lmer(rating~Cohort+Semester_Week+Test_Version+`Item-Level Accuracy`+Baseline_Threat+Gender+Timepoint*Condition+(1|Participant)+(1|Item), data =.x)),# Models with no covariates mod_cov_removed =map(data,~lmer(rating~Cohort+Semester_Week+Test_Version+Gender+Timepoint*Condition+(1|Participant)+(1|Item), data =.x)),# Models with gender interaction mod_gender_interact =map(data,~lmer(rating~Cohort+Semester_Week+Test_Version+`Item-Level Accuracy`+Baseline_Threat+Timepoint*Condition*Gender+(1|Participant)+(1|Item), data =.x)),# Empty means models (only random effects) mod_empty_means =map(data,~lmer(rating~(1|Participant)+(1|Item), data =.x)),# Compare 2-way and 3-way interaction models comparison =pmap(list(mod_full, mod_gender_interact), anova))%>%name_list_columns()# Name the list columns# Data with model-predicted outcome valuespredicted_values<-data_rq1%>%group_by(perception)%>%nest()%>%mutate( predicted =case_match(perception,"Confidence"~map(data,~predict(models_rq1$mod_gender_interact$Confidence, newdata =.x, se.fit =TRUE)%>%as_tibble()),"Anxiety"~map(data,~predict(models_rq1$mod_gender_interact$Anxiety, newdata =.x, se.fit =TRUE)%>%as_tibble()),"Difficulty"~map(data,~predict(models_rq1$mod_full$Difficulty, newdata =.x, se.fit =TRUE)%>%as_tibble())))%>%unnest(c(data, predicted))
Supplementary Table 8.1: Results from Mixed Effects Models Testing Hypotheses 1-3: Effects of Mindfulness Training on Item-Level Judgments While Answering Physics Questions
H1: Confidence
H2: Anxiety
H3: Difficulty
Predictors
Estimates
SE
p
Estimates
SE
p
Estimates
SE
p
(Intercept)
3.69
0.15
<0.001
3.33
0.12
<0.001
3.56
0.12
<0.001
Cohort [Cohort 2]
0.38
0.31
0.222
-0.16
0.43
0.709
-0.52
0.32
0.106
Cohort [Cohort 3]
0.07
0.27
0.785
0.06
0.38
0.868
-0.33
0.28
0.235
Semester Week
0.10
0.05
0.036
-0.04
0.07
0.537
-0.12
0.05
0.019
Test Version [B]
-0.13
0.12
0.268
-0.08
0.10
0.385
-0.07
0.10
0.518
Item-Level Accuracy [Correct]
0.13
0.04
0.005
-0.08
0.04
0.026
-0.03
0.04
0.426
Baseline Threat
-0.24
0.04
<0.001
0.22
0.06
<0.001
0.15
0.04
<0.001
Timepoint [Posttest]
0.19
0.04
<0.001
-0.34
0.03
<0.001
-0.12
0.04
<0.001
Condition [Mindfulness]
0.07
0.11
0.545
-0.25
0.15
0.087
-0.08
0.11
0.479
Gender [Women or Non-binary]
-0.35
0.12
0.003
0.49
0.16
0.002
0.22
0.11
0.048
Timepoint [Posttest] × Condition [Mindfulness]
0.13
0.08
0.089
-0.11
0.07
0.102
-0.29
0.07
<0.001
Timepoint [Posttest] × Gender [Women or Non-binary]
0.06
0.08
0.451
-0.12
0.07
0.071
Condition [Mindfulness] × Gender [Women or Non-binary]
-0.19
0.22
0.391
-0.11
0.30
0.721
(Timepoint [Posttest] × Condition [Mindfulness]) × Gender [Women or Non-binary]
Supplementary Table 8.4: Comparison of Models Predicting Difficulty Judgments
Accuracy and Baseline Threat Removed
2-Way Interaction
3-Way Interaction
Predictors
Estimates
SE
p
Estimates
SE
p
Estimates
SE
p
(Intercept)
3.56
0.13
<0.001
3.56
0.12
<0.001
3.56
0.12
<0.001
Cohort [Cohort 2]
-0.46
0.33
0.166
-0.52
0.32
0.106
-0.52
0.32
0.107
Cohort [Cohort 3]
-0.29
0.29
0.315
-0.33
0.28
0.235
-0.33
0.28
0.234
Semester Week
-0.11
0.05
0.032
-0.12
0.05
0.019
-0.12
0.05
0.019
Test Version [B]
-0.07
0.10
0.528
-0.07
0.10
0.518
-0.07
0.10
0.507
Gender [Women or Non-binary]
0.34
0.11
0.003
0.22
0.11
0.048
0.16
0.12
0.196
Timepoint [Posttest]
-0.12
0.04
<0.001
-0.12
0.04
<0.001
-0.12
0.04
<0.001
Condition [Mindfulness]
-0.10
0.12
0.376
-0.08
0.11
0.479
-0.08
0.11
0.478
Timepoint [Posttest] × Condition [Mindfulness]
-0.29
0.07
<0.001
-0.29
0.07
<0.001
-0.29
0.07
<0.001
Item-Level Accuracy [Correct]
-0.03
0.04
0.426
-0.03
0.04
0.436
Baseline Threat
0.15
0.04
<0.001
0.15
0.04
<0.001
Timepoint [Posttest] × Gender [Women or Non-binary]
0.12
0.07
0.076
Condition [Mindfulness] × Gender [Women or Non-binary]
0.03
0.23
0.910
(Timepoint [Posttest] × Condition [Mindfulness]) × Gender [Women or Non-binary]
0.11
0.14
0.420
Random Effects
σ2
0.93
0.93
0.93
τ00
0.41 Participant
0.37 Participant
0.38 Participant
0.27 Item
0.27 Item
0.27 Item
ICC
0.42
0.41
0.41
N
149 Participant
149 Participant
149 Participant
22 Item
22 Item
22 Item
Observations
3275
3275
3275
Marginal R2 / Conditional R2
0.046 / 0.448
0.068 / 0.448
0.068 / 0.449
8.6 Reproduction of Figure 4
Show/Hide Code
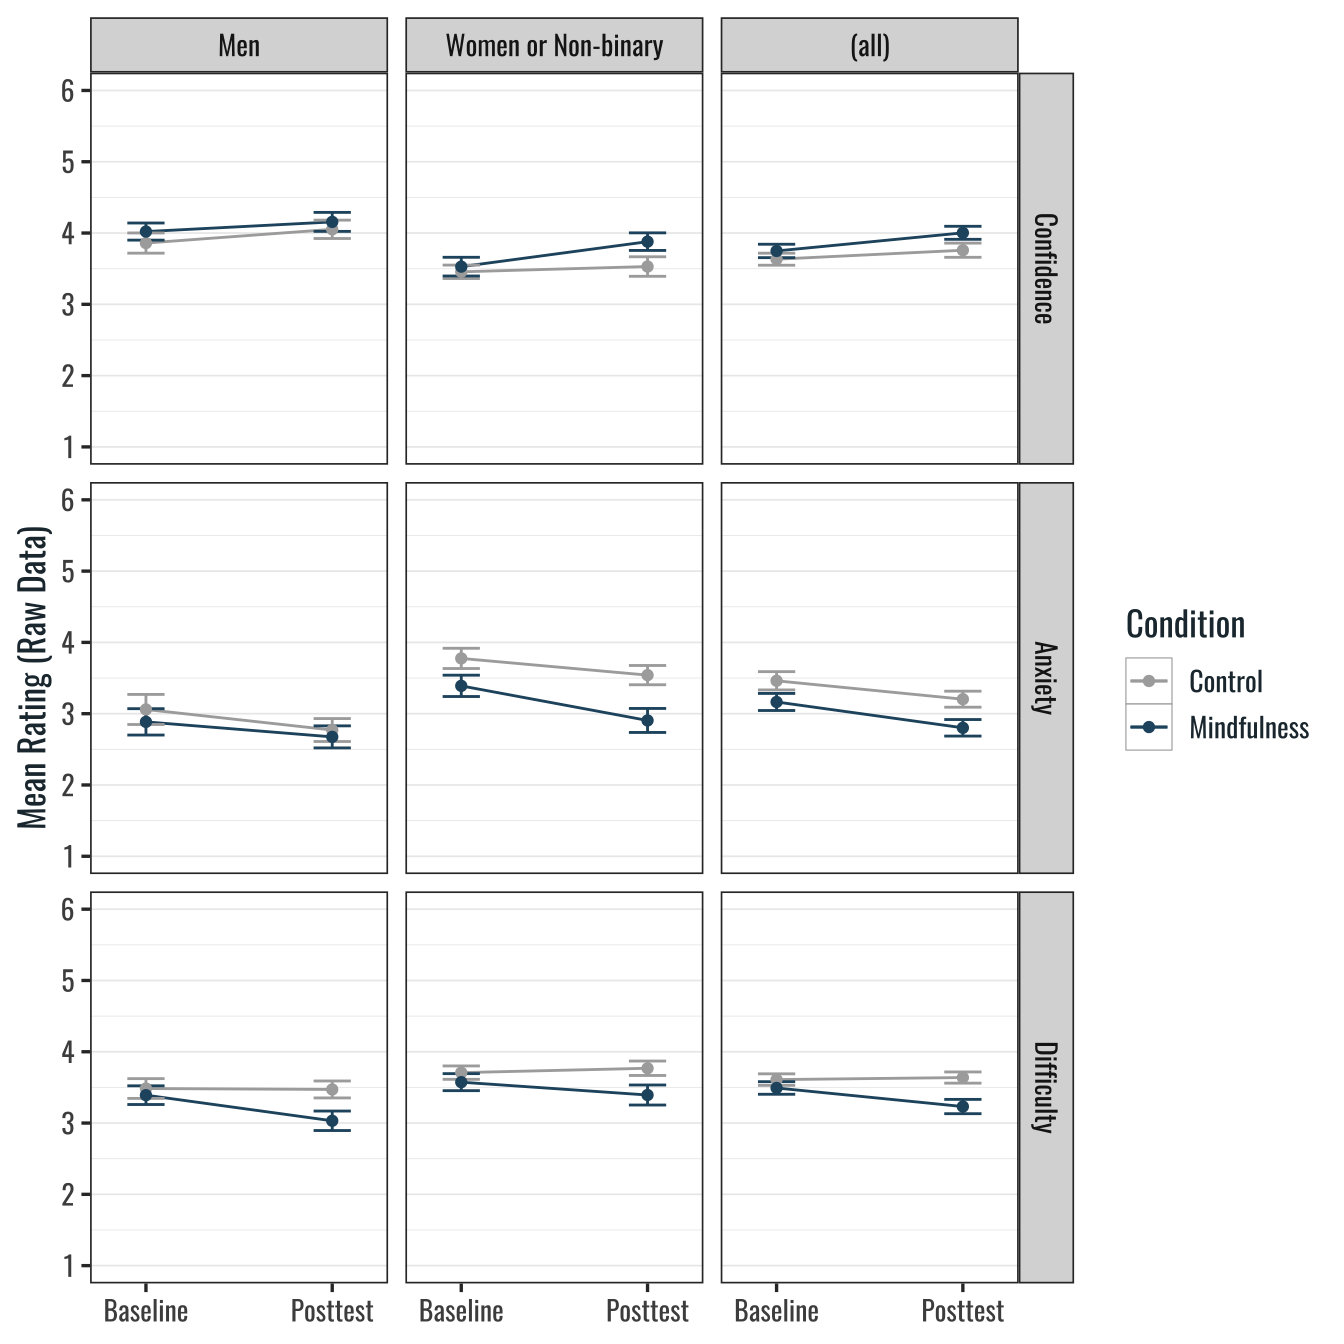
data_rq1%>%group_by(Participant, Gender, perception, Timepoint, Condition)%>%summarise(rating =mean(rating), .groups ="drop")%>%mutate( perception =factor(perception, levels =c("Confidence", "Anxiety", "Difficulty")))%>%ggplot(aes(Timepoint, rating, group =Condition, color =Condition))+facet_grid(perception~Gender, margins ="Gender")+stat_summary(geom ="line", fun ="mean")+stat_summary(geom ="errorbar", fun.data ="mean_se", width =.2)+stat_summary(geom ="point", fun ="mean")+scale_y_continuous(breaks =1:6, limits =c(1, 6))+scale_x_discrete(expand =expansion(mult =.3))+scale_color_manual(values =c(color_cntrl, color_mindful))+labs(x =NULL, y ="Mean Rating (Raw Data)")+theme( legend.position ="right", plot.background =element_rect(fill ='transparent'),# aspect.ratio = 1, legend.background =element_rect(fill ='transparent'), legend.key =element_rect( fill ='white', linewidth =.2, linetype ='solid', color =color_cntrl))
Supplementary Figure 8.1: Participants’ Mean Judgment Ratings at Baseline and Posttest by Experimental Condition and Gender
8.7 Reproduction of Figure 5
Show/Hide Code
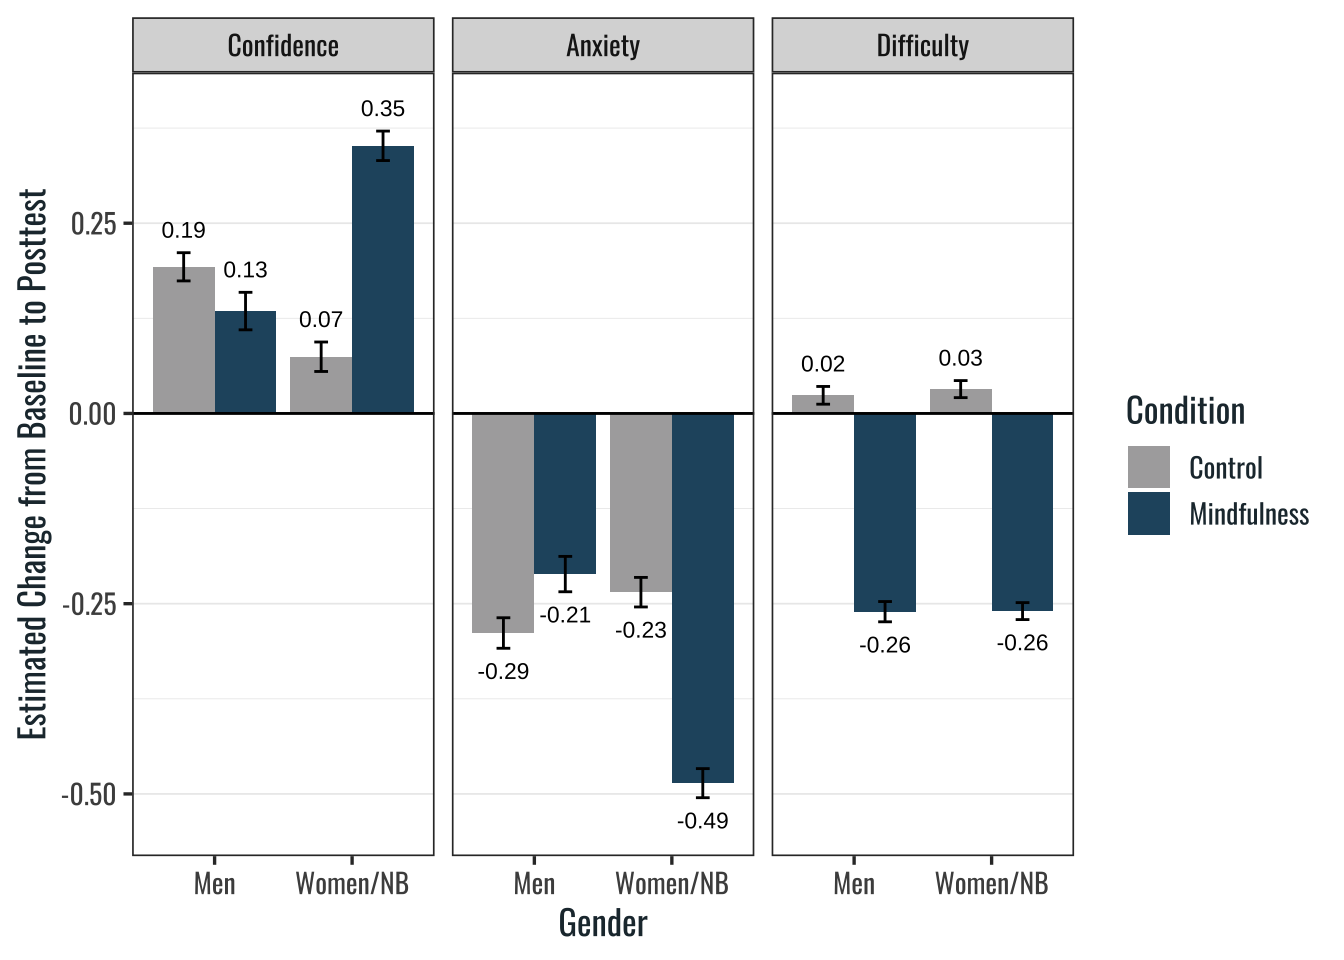
predicted_values%>%# Calculate the mean fit for each participant at baseline and posttestgroup_by(Participant, perception, Gender, Condition, Timepoint)%>%summarise(fit =mean(fit), .groups ="drop")%>%# group by gender, condition and perform a paired t test with equal variance assumedgroup_by(perception, Gender, Condition)%>%t_test( formula =fit~Timepoint, paired =TRUE, var.equal =TRUE, detailed =TRUE, ref.group ="Posttest")%>%# Convert 95% confidence intervals to SEmutate(se =(conf.high-conf.low)/3.92, .after =estimate)%>%# Reorder perception variables to match textmutate(perception =fct_relevel(perception, "Confidence"))%>%ggplot(mapping =aes(x =Gender, y =estimate))+facet_wrap(~perception)+labs(y ="Estimated Change from Baseline to Posttest")+geom_col( position ="dodge", mapping =aes(fill =Condition))+geom_errorbar( mapping =aes(ymin =conf.low, ymax =conf.high, group =Condition), position =position_dodge(.9), width =.2)+geom_text( mapping =aes( label =round(estimate, 2), y =ifelse(estimate<0, conf.low-.03, conf.high+.03), group =Condition), size =3, position =position_dodge(.9))+geom_hline( yintercept =0)+scale_x_discrete(labels =c("Men", "Women/NB"))+scale_fill_manual(values =c(color_cntrl, color_mindful))
Supplementary Figure 8.2: Estimated Marginal Means for Effects of Main Variables of Interest
Source Code
# Research Question 1```{r}#| label: setup#| include: falsesource("R/setup-script.R")```## Model Specification:::{.content-visible when-format="pdf"}Code for model specification not available in PDF format.:::```{r}#| label: model-spec#| cache: true#| message: falsemodels_rq1 <- data_rq1 %>%group_by(perception) %>% nest %>%mutate(# Models with all covariates includedmod_full =map( data,~lmer( rating ~ Cohort + Semester_Week + Test_Version +`Item-Level Accuracy`+ Baseline_Threat + Gender + Timepoint * Condition + (1| Participant) + (1| Item),data = .x ) ),# Models with no covariatesmod_cov_removed =map( data,~lmer( rating ~ Cohort + Semester_Week + Test_Version + Gender + Timepoint * Condition + (1| Participant) + (1| Item),data = .x ) ),# Models with gender interactionmod_gender_interact =map( data,~lmer( rating ~ Cohort + Semester_Week + Test_Version +`Item-Level Accuracy`+ Baseline_Threat + Timepoint * Condition * Gender + (1| Participant) + (1| Item),data = .x ) ),# Empty means models (only random effects)mod_empty_means =map( data,~lmer( rating ~ (1| Participant) + (1| Item),data = .x ) ),# Compare 2-way and 3-way interaction modelscomparison =pmap(list(mod_full, mod_gender_interact), anova) ) %>%name_list_columns() # Name the list columns# Data with model-predicted outcome valuespredicted_values <- data_rq1 %>%group_by(perception) %>%nest() %>%mutate(predicted =case_match( perception,"Confidence"~map( data,~predict( models_rq1$mod_gender_interact$Confidence,newdata = .x,se.fit =TRUE ) %>%as_tibble() ),"Anxiety"~map( data,~predict( models_rq1$mod_gender_interact$Anxiety,newdata = .x,se.fit =TRUE ) %>%as_tibble() ),"Difficulty"~map( data,~predict( models_rq1$mod_full$Difficulty,newdata = .x,se.fit =TRUE ) %>%as_tibble() ) ) ) %>%unnest(c(data, predicted))```## Reproduction of Table 4::: {.content-visible when-format="pdf"}See @tbl-main-tbl-4:::```{r}#| label: tbl-main-tbl-4#| tbl-cap: "Results from Mixed Effects Models Testing Hypotheses 1-3: Effects of Mindfulness Training on Item-Level Judgments While Answering Physics Questions"handle_model_print(list( models_rq1$mod_gender_interact$Confidence, models_rq1$mod_gender_interact$Anxiety, models_rq1$mod_full$Difficulty ), str_perception_levels |> (\(x) paste0("H", 1:3, ": ", x))(),n_models =3,is_lmer =TRUE,raneff_rownum =15)```## Confidence Judgments: Model Comparison::: {.content-visible when-format="pdf"}See @tbl-confidence-models:::```{r}#| label: tbl-confidence-models#| tbl-cap: "Comparison of Models Predicting Confidence Judgments"handle_model_print(list( models_rq1$mod_cov_removed$Confidence, models_rq1$mod_full$Confidence, models_rq1$mod_gender_interact$Confidence ),c("Accuracy and Baseline Threat Removed","2-Way Interaction","3-Way Interaction" ),n_models =3,is_lmer =TRUE,raneff_rownum =15)```## Anxiety Judgments: Model Comparison::: {.content-visible when-format="pdf"}See @tbl-anxiety-models:::```{r}#| label: tbl-anxiety-models#| tbl-cap: "Comparison of Models Predicting Anxiety Judgments"handle_model_print(list( models_rq1$mod_cov_removed$Anxiety, models_rq1$mod_full$Anxiety, models_rq1$mod_gender_interact$Anxiety ),c("Accuracy and Baseline Threat Removed","2-Way Interaction","3-Way Interaction" ),n_models =3,is_lmer =TRUE,raneff_rownum =15)```## Difficulty Judgments: Model Comparison::: {.content-visible when-format="pdf"}See @tbl-difficulty-models:::```{r}#| label: tbl-difficulty-models#| tbl-cap: "Comparison of Models Predicting Difficulty Judgments"handle_model_print(list( models_rq1$mod_cov_removed$Difficulty, models_rq1$mod_full$Difficulty, models_rq1$mod_gender_interact$Difficulty ),c("Accuracy and Baseline Threat Removed","2-Way Interaction","3-Way Interaction" ),n_models =3,is_lmer =TRUE,raneff_rownum =15)```## Reproduction of Figure 4::: {.content-visible when-format="pdf"}See @fig-main-fig-4:::```{r}#| label: fig-main-fig-4#| fig-cap: "Participants' Mean Judgment Ratings at Baseline and Posttest by Experimental Condition and Gender"#| fig-asp: 1data_rq1 %>%group_by(Participant, Gender, perception, Timepoint, Condition) %>%summarise(rating =mean(rating), .groups ="drop") %>%mutate(perception =factor( perception,levels =c("Confidence", "Anxiety", "Difficulty") ) ) %>%ggplot(aes(Timepoint, rating, group = Condition, color = Condition)) +facet_grid(perception ~ Gender, margins ="Gender") +stat_summary(geom ="line", fun ="mean") +stat_summary(geom ="errorbar", fun.data ="mean_se", width = .2) +stat_summary(geom ="point", fun ="mean") +scale_y_continuous(breaks =1:6, limits =c(1, 6)) +scale_x_discrete(expand =expansion(mult = .3)) +scale_color_manual(values =c(color_cntrl, color_mindful)) +labs(x =NULL, y ="Mean Rating (Raw Data)") +theme(legend.position ="right",plot.background =element_rect(fill ='transparent'),# aspect.ratio = 1,legend.background =element_rect(fill ='transparent'),legend.key =element_rect(fill ='white',linewidth = .2,linetype ='solid',color = color_cntrl ) )```## Reproduction of Figure 5 ::: {.content-visible when-format="pdf"}See @fig-main-fig-5:::```{r}#| label: fig-main-fig-5#| fig-cap: "Estimated Marginal Means for Effects of Main Variables of Interest"predicted_values %>%# Calculate the mean fit for each participant at baseline and posttestgroup_by(Participant, perception, Gender, Condition, Timepoint) %>%summarise(fit =mean(fit), .groups ="drop") %>%# group by gender, condition and perform a paired t test with equal variance assumedgroup_by(perception, Gender, Condition) %>%t_test(formula = fit ~ Timepoint,paired =TRUE,var.equal =TRUE,detailed =TRUE,ref.group ="Posttest" ) %>%# Convert 95% confidence intervals to SEmutate(se = (conf.high - conf.low) /3.92, .after = estimate) %>%# Reorder perception variables to match textmutate(perception =fct_relevel(perception, "Confidence")) %>%ggplot(mapping =aes(x = Gender, y = estimate)) +facet_wrap(~perception) +labs(y ="Estimated Change from Baseline to Posttest") +geom_col(position ="dodge",mapping =aes(fill = Condition) ) +geom_errorbar(mapping =aes(ymin = conf.low, ymax = conf.high, group = Condition),position =position_dodge(.9),width = .2 ) +geom_text(mapping =aes(label =round(estimate, 2),y =ifelse(estimate <0, conf.low - .03, conf.high + .03),group = Condition ),size =3,position =position_dodge(.9) ) +geom_hline(yintercept =0 ) +scale_x_discrete(labels =c("Men", "Women/NB")) +scale_fill_manual(values =c(color_cntrl, color_mindful))```