# Research Question 2
```{r}
#| label: setup
#| include: false
source("R/setup-script.R")
```
## Model Specification
Mediation tests were conducted using `mediation::mediate()` using bias-corrected bootstrapped confidence intervals.
::: {.content-visible when-format="pdf"}
Code for model specification not available in PDF format.
:::
```{r}
#| label: model-spec
#| cache: true
# Formula for c path

formula_t <- function(perception) {
  as.formula(
    paste0(
      "Posttest_",
      perception,
      " ~
          Condition * Gender +
          Baseline_Score +
          Cohort_2 +
          Cohort_3 +
          Semester_Week +
          Posttest_Test_Version +
          Baseline_Threat +
          Baseline_",
      perception
    )
  )
}

# Formula for a path

formula_m <- function(perception) {
  as.formula(
    paste0(
      "EMA_Threat ~
          Condition * Gender +
          Baseline_Score +
          Cohort_2 +
          Cohort_3 +
          Semester_Week +
          Posttest_Test_Version +
          Baseline_Threat +
          Baseline_",
      perception
    )
  )
}

# Formula for c' and b paths

formula_y <- function(perception) {
  as.formula(
    paste0(
      "Posttest_",
      perception,
      " ~
          Condition * Gender +
          EMA_Threat * Gender +
          Baseline_Score +
          Cohort_2 +
          Cohort_3 +
          Semester_Week +
          Posttest_Test_Version +
          Baseline_Threat +
          Baseline_",
      perception
    )
  )
}

# Function for removing gender moderations from paths
# to show overall effects
remove_interactions <- function(perception, formula_fun) {
  update.formula(
    formula_fun(perception),
    . ~ . - Condition:Gender - Gender:EMA_Threat
  )
}

# Helper function to create lm with proper call
lm_with_call <- function(formula_func, perception, data, mod = TRUE) {
  if (mod) {
    formula <- formula_func(perception)
  } else {
    formula <- remove_interactions(perception, formula_func)
  }
  model <- lm(formula, data = data)
  model$call <- call("lm", formula = formula, data = quote(data))
  return(model)
}

# Linear models with men coded as 0
models_rq2_men <- bind_rows(
  list(
    Confidence = data_rq2,
    Anxiety = data_rq2,
    Difficulty = data_rq2
  ),
  .id = "perception"
) %>%
  nest(.by = "perception") %>%
  mutate(
    mod_t = map2(data, perception, ~ lm_with_call(formula_t, .y, .x)),
    mod_m = map2(data, perception, ~ lm_with_call(formula_m, .y, .x)),
    mod_y = map2(data, perception, ~ lm_with_call(formula_y, .y, .x))
  ) %>%
  group_by(perception) %>%
  name_list_columns()


# Linear models with women and non-binary students coded as 0
models_rq2_women <- bind_rows(
  list(
    Confidence = data_rq2,
    Anxiety = data_rq2,
    Difficulty = data_rq2
  ),
  .id = "perception"
) %>%
  # Reverse gender coding for women/nb path models
  mutate(Gender = fct_relevel(Gender, "Women or Non-binary")) %>%
  nest(.by = "perception") %>%
  mutate(
    mod_t = map2(data, perception, ~ lm_with_call(formula_t, .y, .x)),
    mod_m = map2(data, perception, ~ lm_with_call(formula_m, .y, .x)),
    mod_y = map2(data, perception, ~ lm_with_call(formula_y, .y, .x))
  ) %>%
  group_by(perception) %>%
  name_list_columns()

# Linear models without gender moderation
models_rq2_no_mod <- bind_rows(
  list(
    Confidence = data_rq2,
    Anxiety = data_rq2,
    Difficulty = data_rq2
  ),
  .id = "perception"
) %>%
  nest(.by = "perception") %>%
  mutate(
    mod_t = map2(
      data,
      perception,
      ~ lm_with_call(formula_t, .y, .x, mod = FALSE)
    ),
    mod_m = map2(
      data,
      perception,
      ~ lm_with_call(formula_m, .y, .x, mod = FALSE)
    ),
    mod_y = map2(
      data,
      perception,
      ~ lm_with_call(formula_y, .y, .x, mod = FALSE)
    )
  ) %>%
  group_by(perception) %>%
  name_list_columns()

# Function for printing model results
tab_rq2_models <- function(df, perception) {
  lbl_out <- paste0("Posttest ", perception)

  handle_model_print(
    mods <- list(
      df$mod_t[[perception]],
      df$mod_m[[perception]],
      df$mod_y[[perception]]
    ),
    nm = paste0(
      "Model ",
      1:3,
      " DV:<br>",
      c(lbl_out, "EMA Threat", lbl_out)
    ),
    n_models = 3
  )
}

# Function for printing path diagram
plot_path_diagram <- function(perception, gender) {
  df <- get(paste0("models_rq2_", gender), envir = .GlobalEnv)

  if (gender == "no_mod") {
    dv <- paste0(perception, "\n(Overall)")
  } else {
    dv <- paste0(perception, "\n(", str_to_title(gender), ")")
  }

  p <- gg_path_diagram(
    mod_t = df$mod_t[[perception]],
    mod_m = df$mod_m[[perception]],
    mod_y = df$mod_y[[perception]],
    str_med = "EMA_Threat",
    str_iv = "ConditionMindfulness",
    lbl_med = "EMA Threat",
    lbl_iv = "Mindfulness",
    lbl_dv = dv,
    pad_x = 3.5
  )

  return(p)
}

# Function for running mediation models for each level of the moderator (using mediation package)

my_mediate <- function(
  df = models_rq2_men,
  perception,
  gender,
  sims = med_sims
) {
  if (gender == "men") {
    lbl_gender <- "Men"
  } else {
    lbl_gender <- "Women or Non-binary"
  }

  set.seed(1983)

  mediation::mediate(
    model.m = df$mod_m[[perception]],
    model.y = df$mod_y[[perception]],
    sim = sims,
    boot = TRUE,
    boot.ci.type = "bca",
    covariates = list(Gender = lbl_gender),
    treat = "Condition",
    mediator = "EMA_Threat",
    control.value = "Control",
    treat.value = "Mindfulness"
  )
}

my_mediate_no_mod <- function(
  df = models_rq2_no_mod,
  perception,
  sims = med_sims
) {
  set.seed(1983)

  mediation::mediate(
    model.m = df$mod_m[[perception]],
    model.y = df$mod_y[[perception]],
    sim = sims,
    boot = TRUE,
    boot.ci.type = "bca",
    treat = "Condition",
    mediator = "EMA_Threat",
    control.value = "Control",
    treat.value = "Mindfulness"
  )
}
```
## Confidence
### Men Results
#### Linear Model Results
::: {.content-visible when-format="pdf"}
See @tbl-conf-men
:::
```{r}
#| label: tbl-conf-men
#| tbl-cap: "Mediation Analysis for Confidence at Posttest: Men"
#| cache: true
tab_rq2_models(models_rq2_men, "Confidence")
```
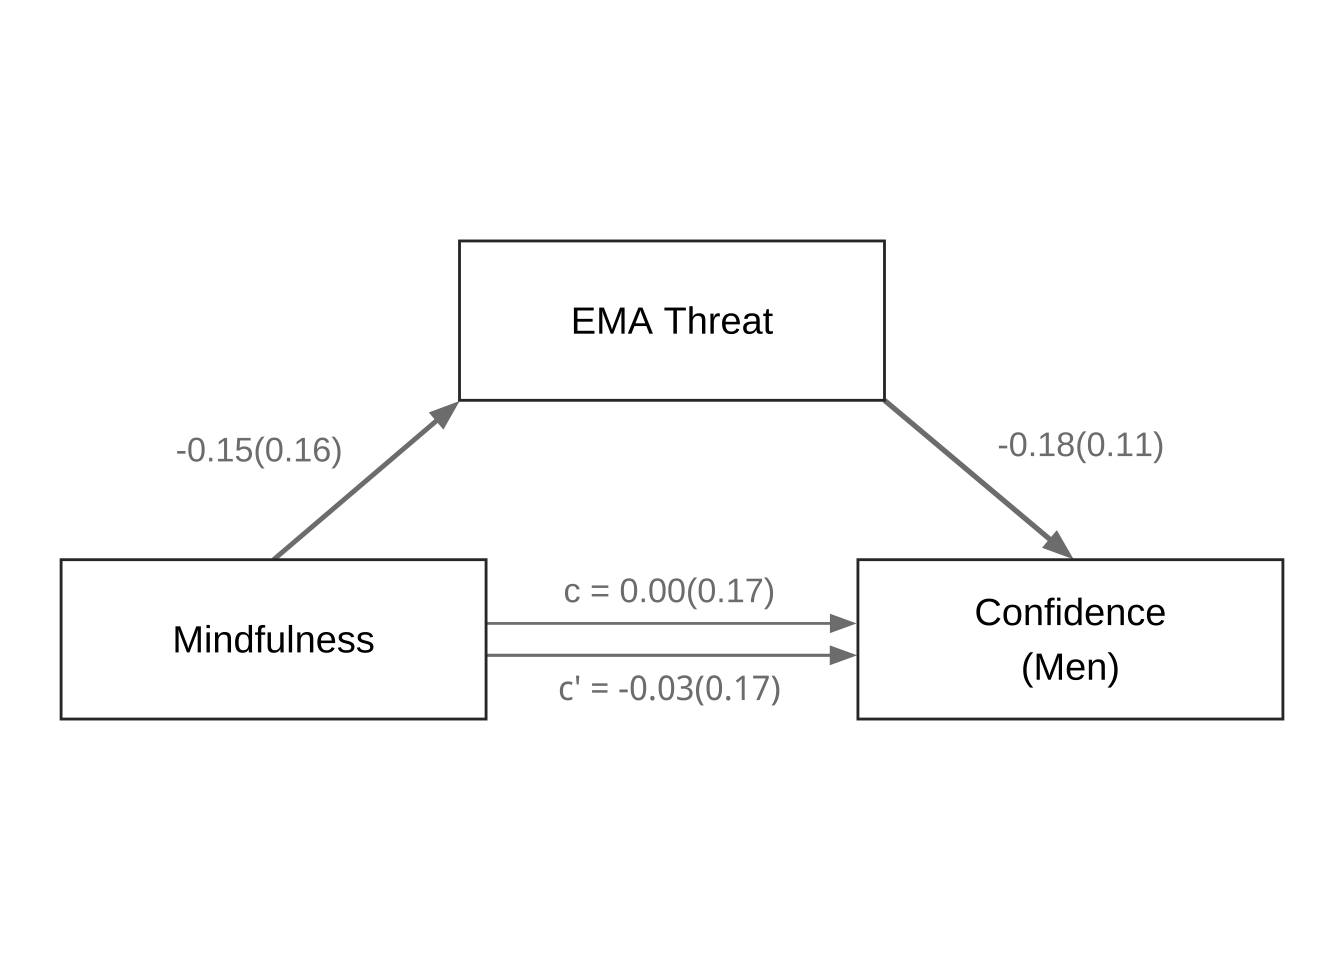
#### Path Diagram
::: {.content-visible when-format="pdf"}
See @fig-conf-men
:::
```{r}
#| label: fig-conf-men
#| fig-cap: "Mediation Analysis for Confidence at Posttest: Men"
#| cache: true
plot_path_diagram("Confidence", "men")
```
#### Mediation Test
::: {.content-visible when-format="pdf"}
See @tbl-med-conf-men
:::
```{r}
#| label: tbl-med-conf-men
#| tbl-cap: "Mediation Analysis for Confidence at Posttest: Men"
#| cache: true
my_mediate(perception = "Confidence", gender = "men") %>% kable_mediation()
```
### Women or Non-binary Results
##### Linear Model Results
::: {.content-visible when-format="pdf"}
See @tbl-conf-wnb
:::
```{r}
#| label: tbl-conf-wnb
#| tbl-cap: "Mediation Analysis for Confidence at Posttest: Women"
#| cache: true
tab_rq2_models(models_rq2_women, "Confidence")
```
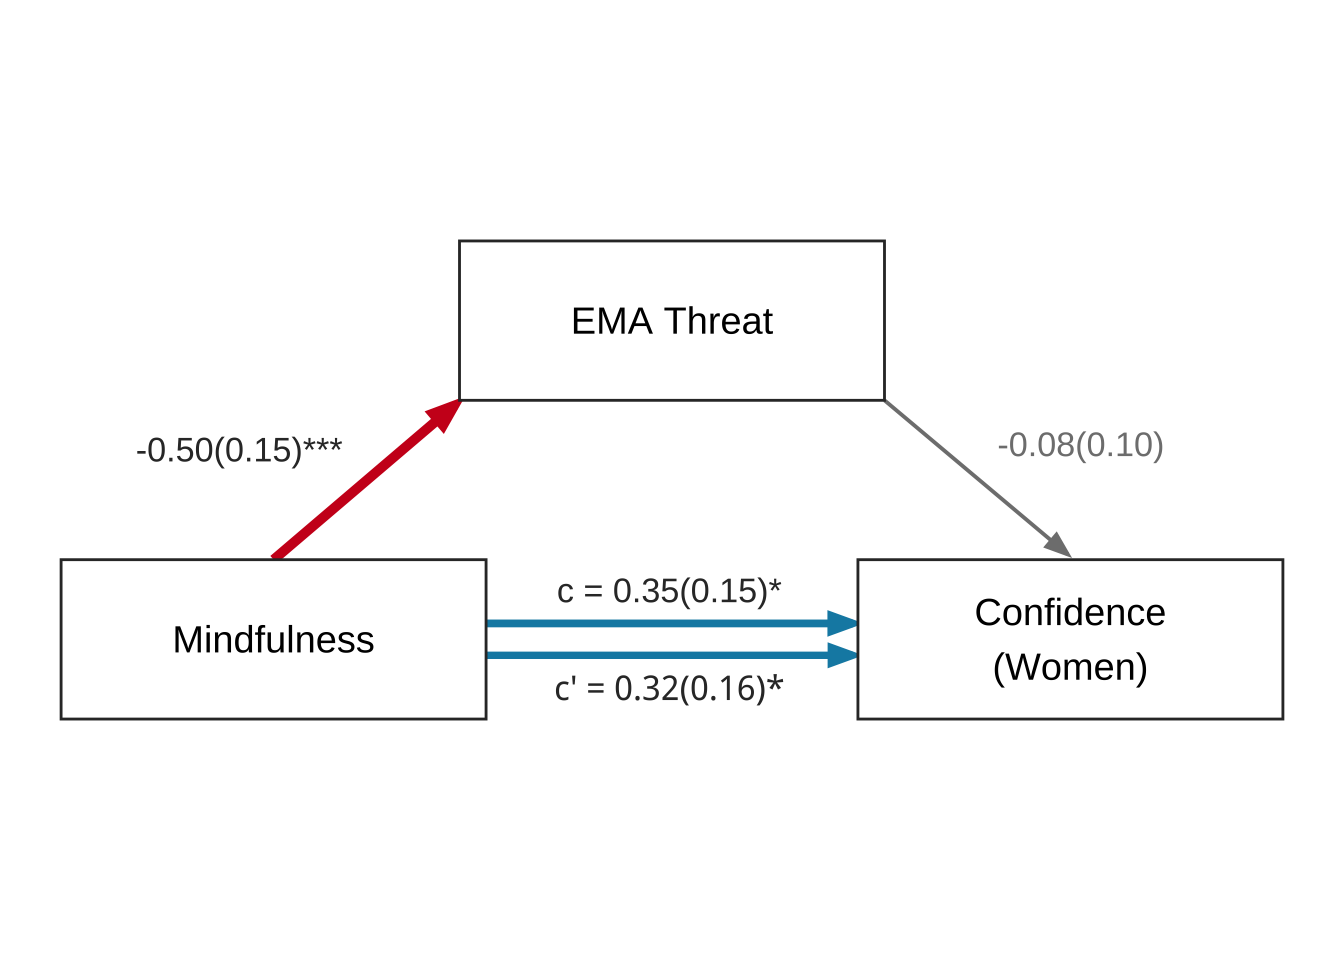
##### Path Diagram
::: {.content-visible when-format="pdf"}
See @fig-conf-wnb
:::
```{r}
#| label: fig-conf-wnb
#| fig-cap: "Mediation Analysis for Confidence at Posttest: Women"
#| cache: true
plot_path_diagram("Confidence", "women")
```
##### Mediation Test
::: {.content-visible when-format="pdf"}
See @tbl-med-conf-wnb
:::
```{r}
#| label: tbl-med-conf-wnb
#| tbl-cap: "Mediation Analysis for Confidence at Posttest: Women"
#| cache: true
my_mediate(perception = "Confidence", gender = "women") %>% kable_mediation()
```
## Anxiety
### Men Results
#### Linear Model Results
::: {.content-visible when-format="pdf"}
See @tbl-anx-men
:::
```{r}
#| label: tbl-anx-men
#| tbl-cap: "Mediation Analysis for Anxiety at Posttest: Men"
#| cache: true
tab_rq2_models(models_rq2_men, "Anxiety")
```
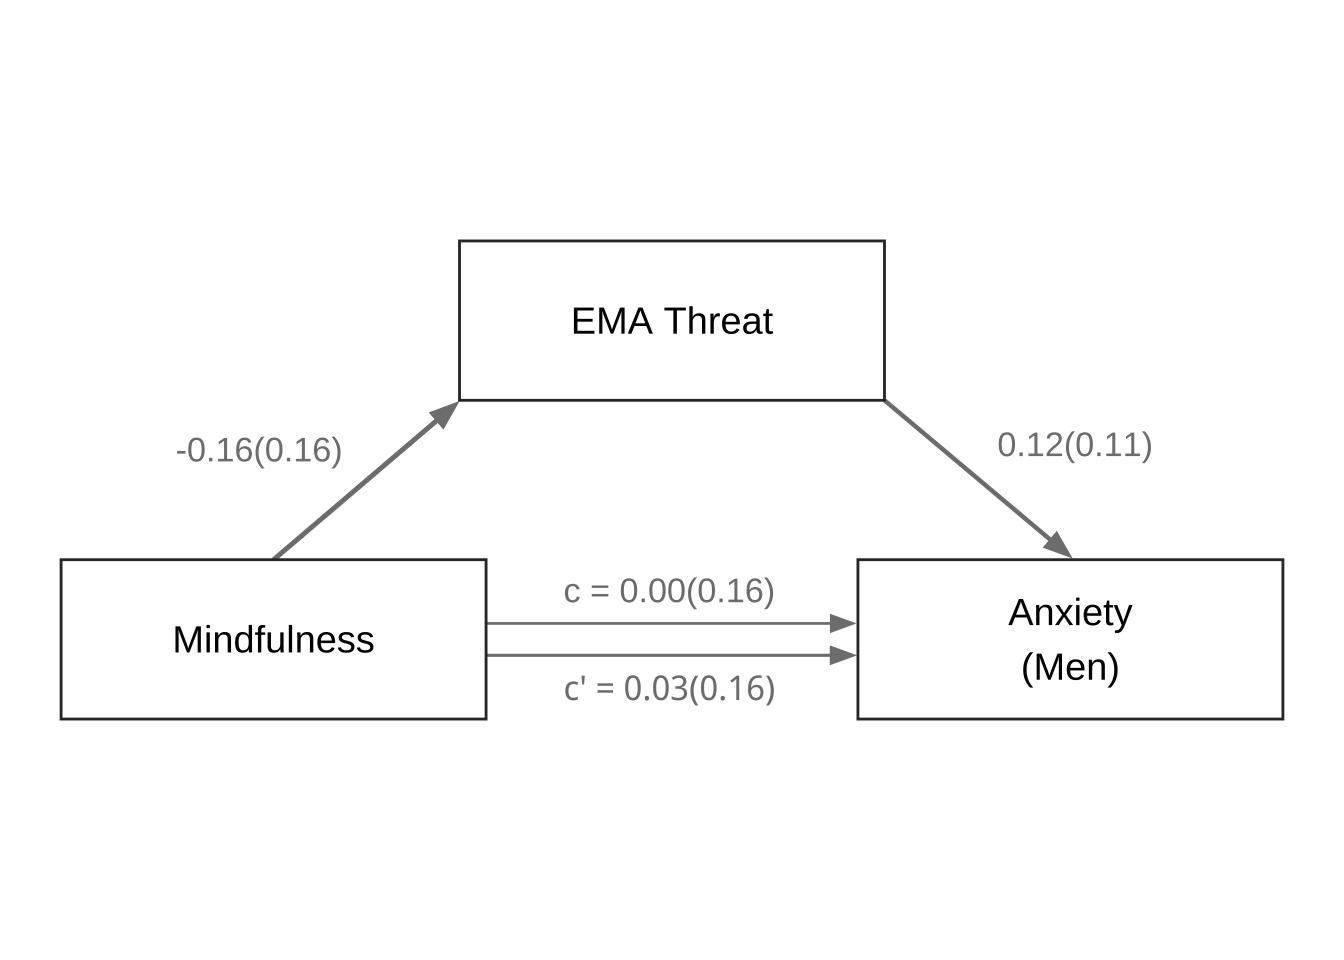
#### Path Diagram
::: {.content-visible when-format="pdf"}
See @fig-anx-men
:::
```{r}
#| label: fig-anx-men
#| fig-cap: "Mediation Analysis for Anxiety at Posttest: Men"
#| cache: true
plot_path_diagram("Anxiety", "men")
```
#### Mediation Test
::: {.content-visible when-format="pdf"}
See @tbl-med-anx-men
:::
```{r}
#| label: tbl-med-anx-men
#| tbl-cap: "Mediation Analysis for Anxiety at Posttest: Men"
#| cache: true
my_mediate(perception = "Anxiety", gender = "men") %>% kable_mediation()
```
### Women or Non-binary Results
##### Linear Model Results
::: {.content-visible when-format="pdf"}
See @tbl-anx-wnb
:::
```{r}
#| label: tbl-anx-wnb
#| tbl-cap: "Mediation Analysis for Anxiety at Posttest: Women"
#| cache: true
tab_rq2_models(models_rq2_women, "Anxiety")
```
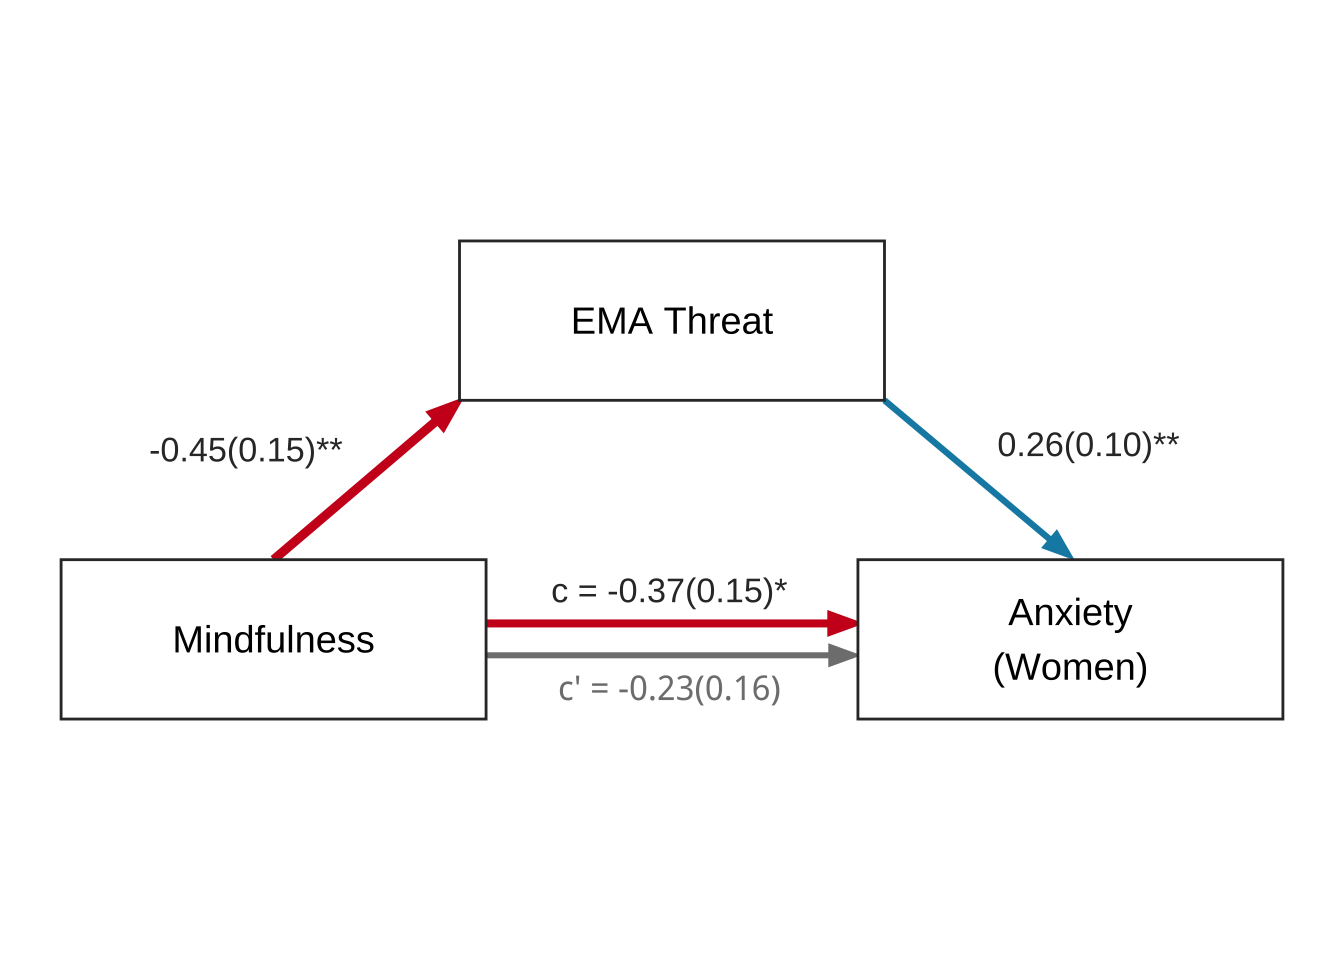
##### Path Diagram
::: {.content-visible when-format="pdf"}
See @fig-anx-wnb
:::
```{r}
#| label: fig-anx-wnb
#| fig-cap: "Mediation Analysis for Confidence at Posttest: Women"
#| cache: true
plot_path_diagram("Anxiety", "women")
```
##### Mediation Test
::: {.content-visible when-format="pdf"}
See @tbl-med-anx-wnb
:::
```{r}
#| label: tbl-med-anx-wnb
#| tbl-cap: "Mediation Analysis for Confidence at Posttest: Women"
#| cache: true
my_mediate(perception = "Anxiety", gender = "women") %>% kable_mediation()
```
## Difficulty
### Men Results
#### Linear Model Results
::: {.content-visible when-format="pdf"}
See @tbl-diff-men
:::
```{r}
#| label: tbl-diff-men
#| tbl-cap: "Mediation Analysis for Difficulty at Posttest: Men"
#| cache: true
tab_rq2_models(models_rq2_men, "Difficulty")
```
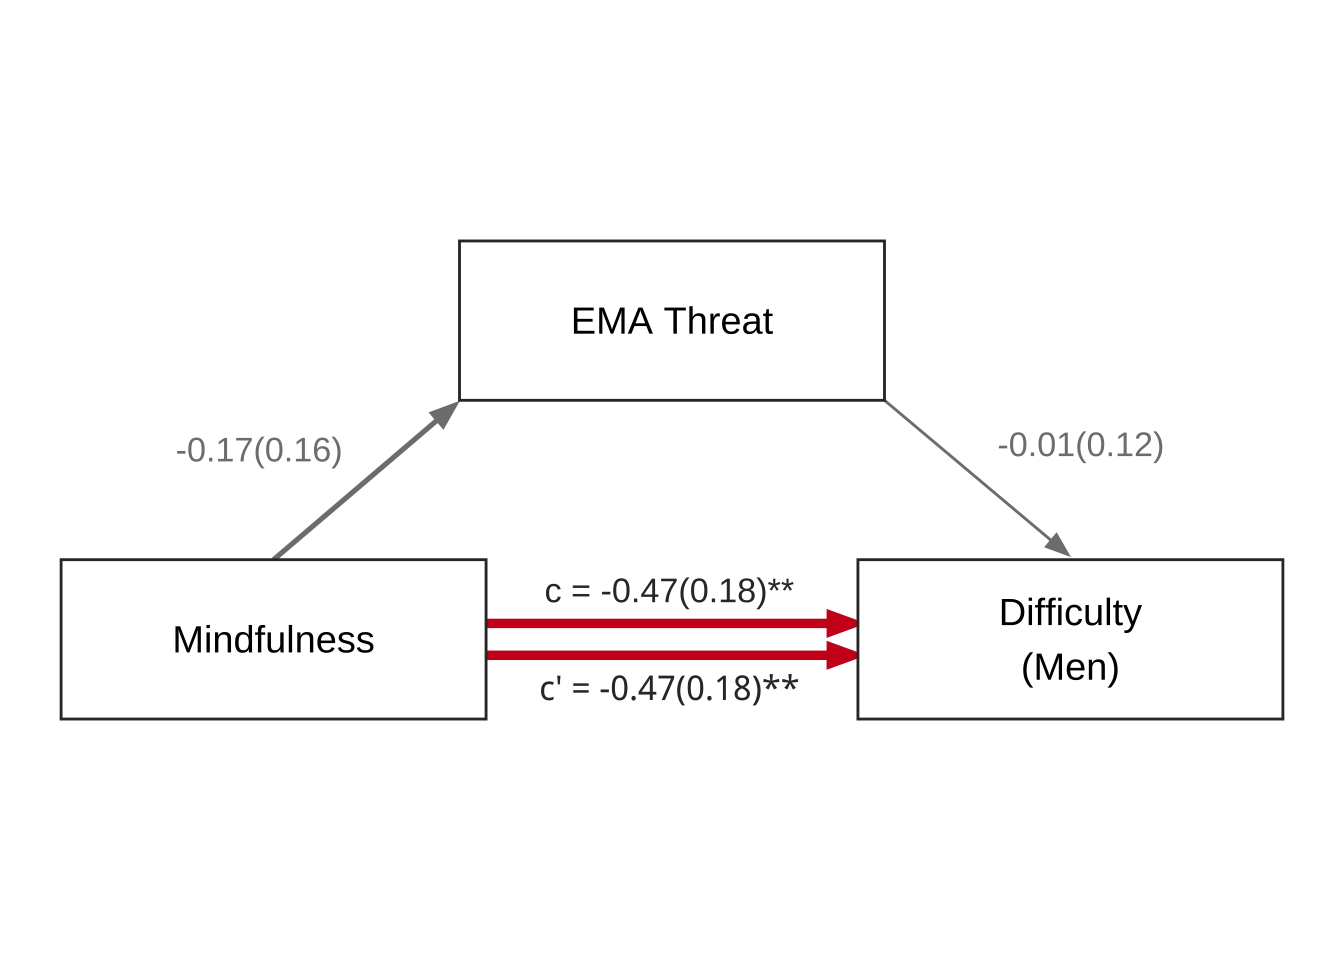
#### Path Diagram
::: {.content-visible when-format="pdf"}
See @fig-diff-men
:::
```{r}
#| label: fig-diff-men
#| fig-cap: "Mediation Analysis for Difficulty at Posttest: Men"
#| cache: true
plot_path_diagram("Difficulty", "men")
```
#### Mediation Test
::: {.content-visible when-format="pdf"}
See @tbl-med-diff-men
:::
```{r}
#| label: tbl-med-diff-men
#| tbl-cap: "Mediation Analysis for Difficulty at Posttest: Men"
#| cache: true
my_mediate(perception = "Difficulty", gender = "men") %>% kable_mediation()
```
### Women or Non-binary Results
#### Linear Model Results
::: {.content-visible when-format="pdf"}
See @tbl-diff-wnb
:::
```{r}
#| label: tbl-diff-wnb
#| tbl-cap: "Mediation Analysis for Difficulty at Posttest: Women"
#| cache: true
tab_rq2_models(models_rq2_women, "Difficulty")
```
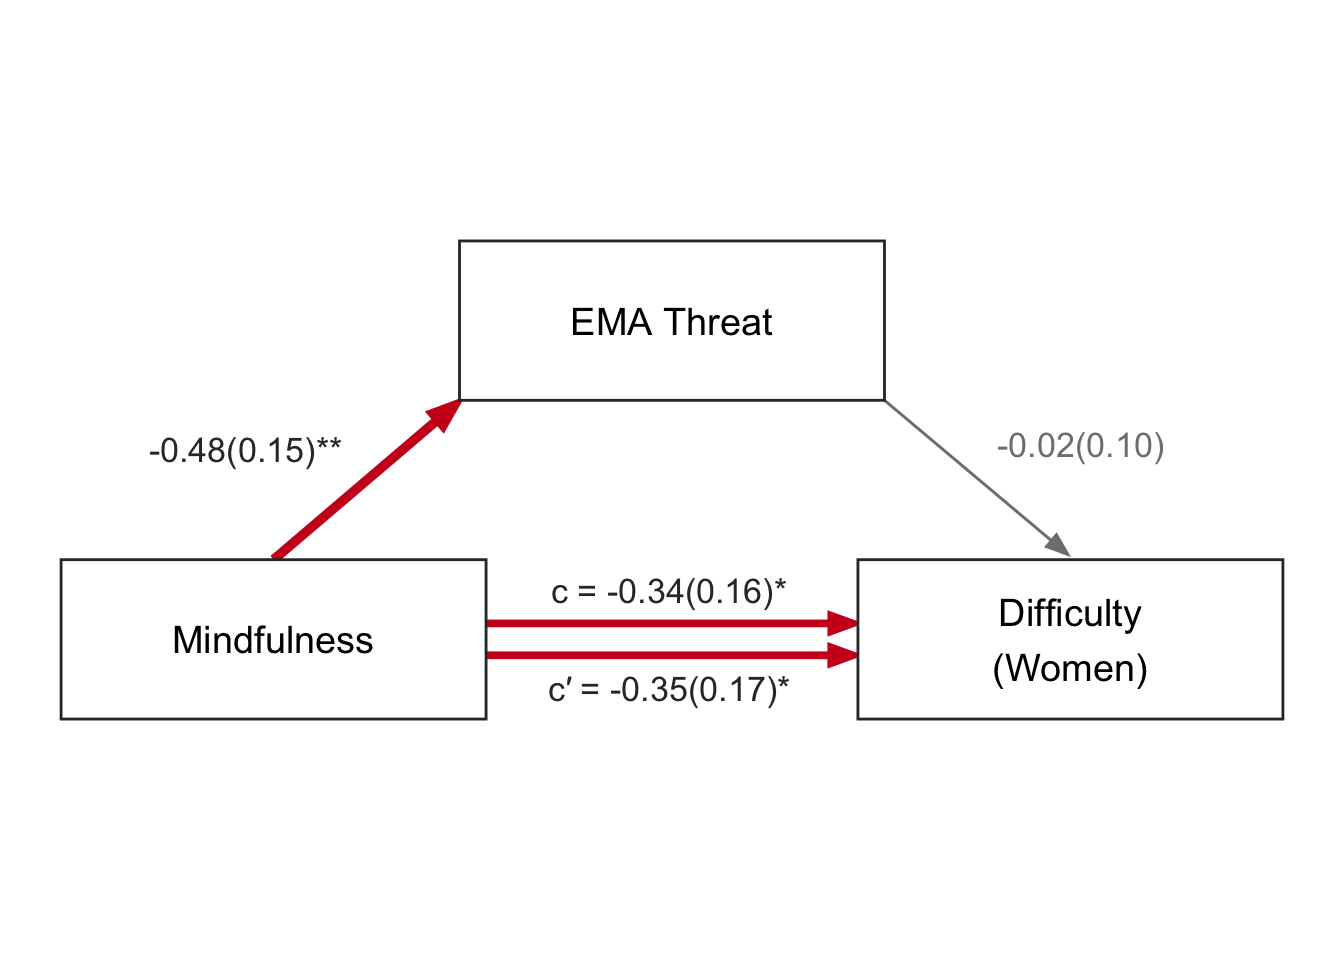
#### Path Diagram
::: {.content-visible when-format="pdf"}
See @fig-diff-wnb
:::
```{r}
#| label: fig-diff-wnb
#| fig-cap: "Mediation Analysis for Difficulty at Posttest: Women"
#| cache: true
plot_path_diagram("Difficulty", "women")
```
#### Mediation Test
::: {.content-visible when-format="pdf"}
See @tbl-med-diff-wnb
:::
```{r}
#| label: tbl-med-diff-wnb
#| tbl-cap: "Mediation Analysis for Difficulty at Posttest: Women"
my_mediate(perception = "Difficulty", gender = "women") %>% kable_mediation()
```
## Unmoderated Mediation Results (preregistered analyses){#sec-preregistered}
### Confidence
#### Linear Models
```{r}
#| label: tbl-rq2-prereg-1
#| tbl-cap: Mediation Analysis for Confidence at Posttest without Gender Moderation
tab_rq2_models(models_rq2_no_mod, "Confidence")
```
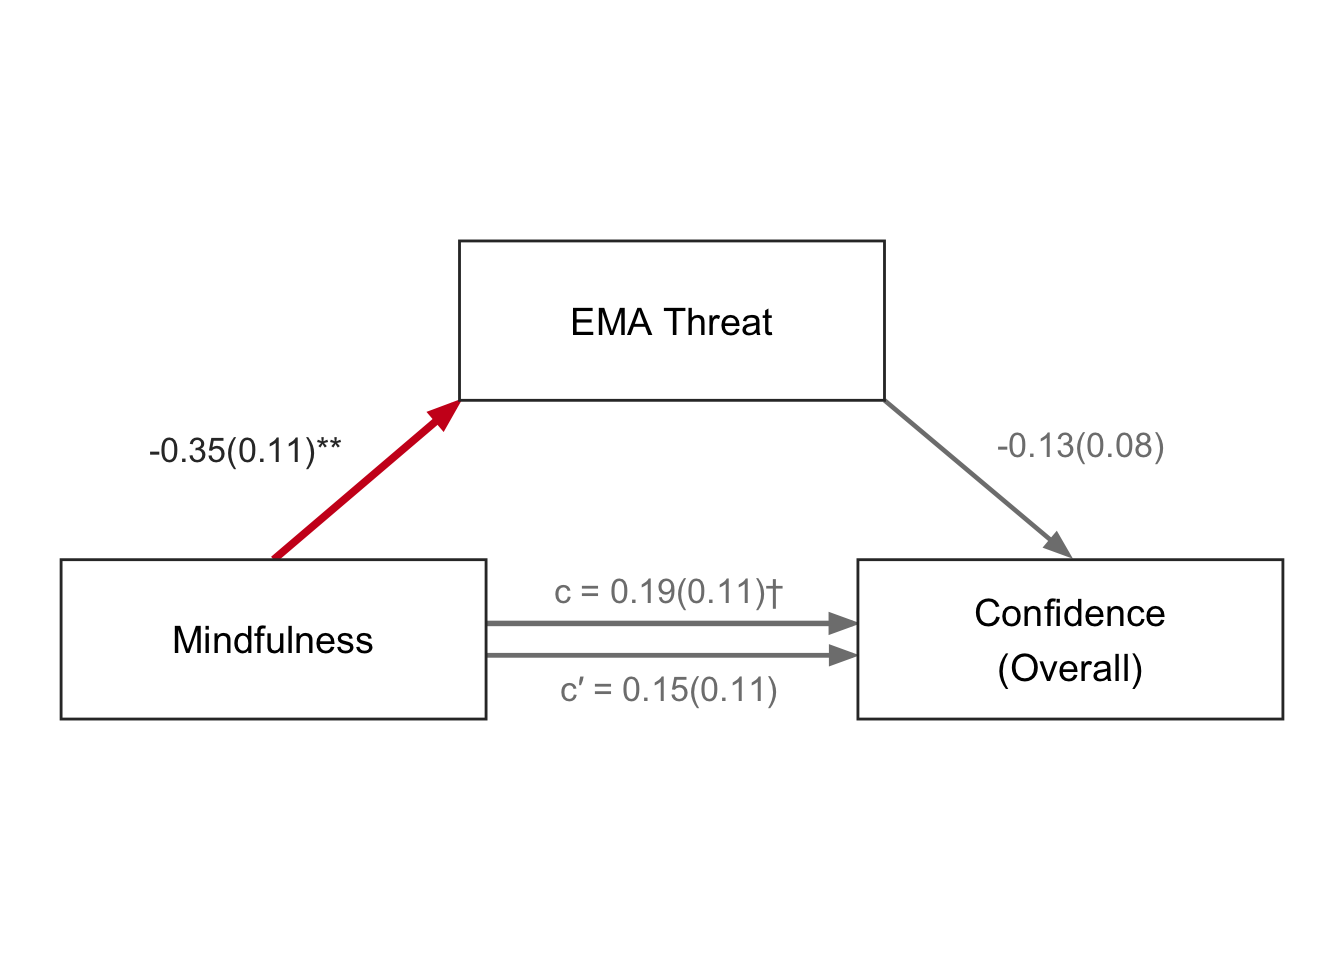
#### Path Diagram
```{r}
#| label: fig-rq2-prereg-2
#| fig-cap: Mediation Analysis for Confidence at Posttest without Gender Moderation
plot_path_diagram("Confidence", "no_mod")
```
#### Mediation Test
```{r}
#| label: tbl-med-rq2-prereg-3
#| tbl-cap: Mediation Analysis for Confidence at Posttest without Gender Moderation
my_mediate_no_mod(perception = "Confidence") |> kable_mediation()
```
### Anxiety
#### Linear Models
```{r}
#| label: tbl-rq2-prereg-4
#| tbl-cap: Mediation Analysis for Anxiety at Posttest without Gender Moderation
tab_rq2_models(models_rq2_no_mod, "Anxiety")
```
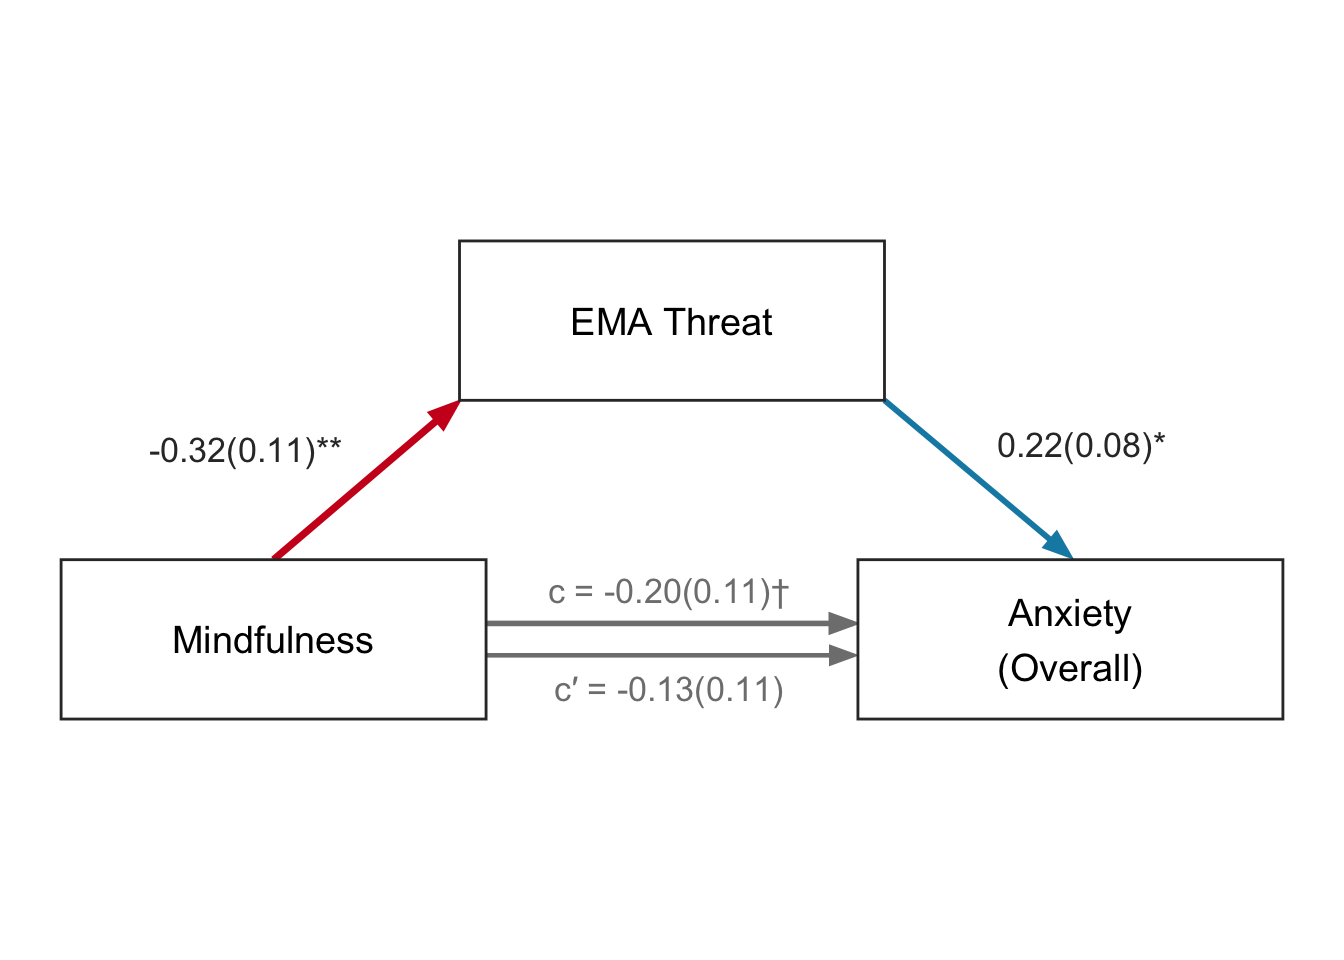
#### Path Diagram
```{r}
#| label: fig-rq2-prereg-5
#| fig-cap: Mediation Analysis for Anxiety at Posttest without Gender Moderation
plot_path_diagram("Anxiety", "no_mod")
```
#### Mediation Test
```{r}
#| label: tbl-med-rq2-prereg-6
#| tbl-cap: Mediation Analysis for Anxiety at Posttest without Gender Moderation
my_mediate_no_mod(perception = "Anxiety") |> kable_mediation()
```
### Difficulty
#### Linear Models
```{r}
#| label: tbl-rq2-prereg-7
#| tbl-cap: Mediation Analysis for Difficulty at Posttest without Gender Moderation
tab_rq2_models(models_rq2_no_mod, "Difficulty")
```
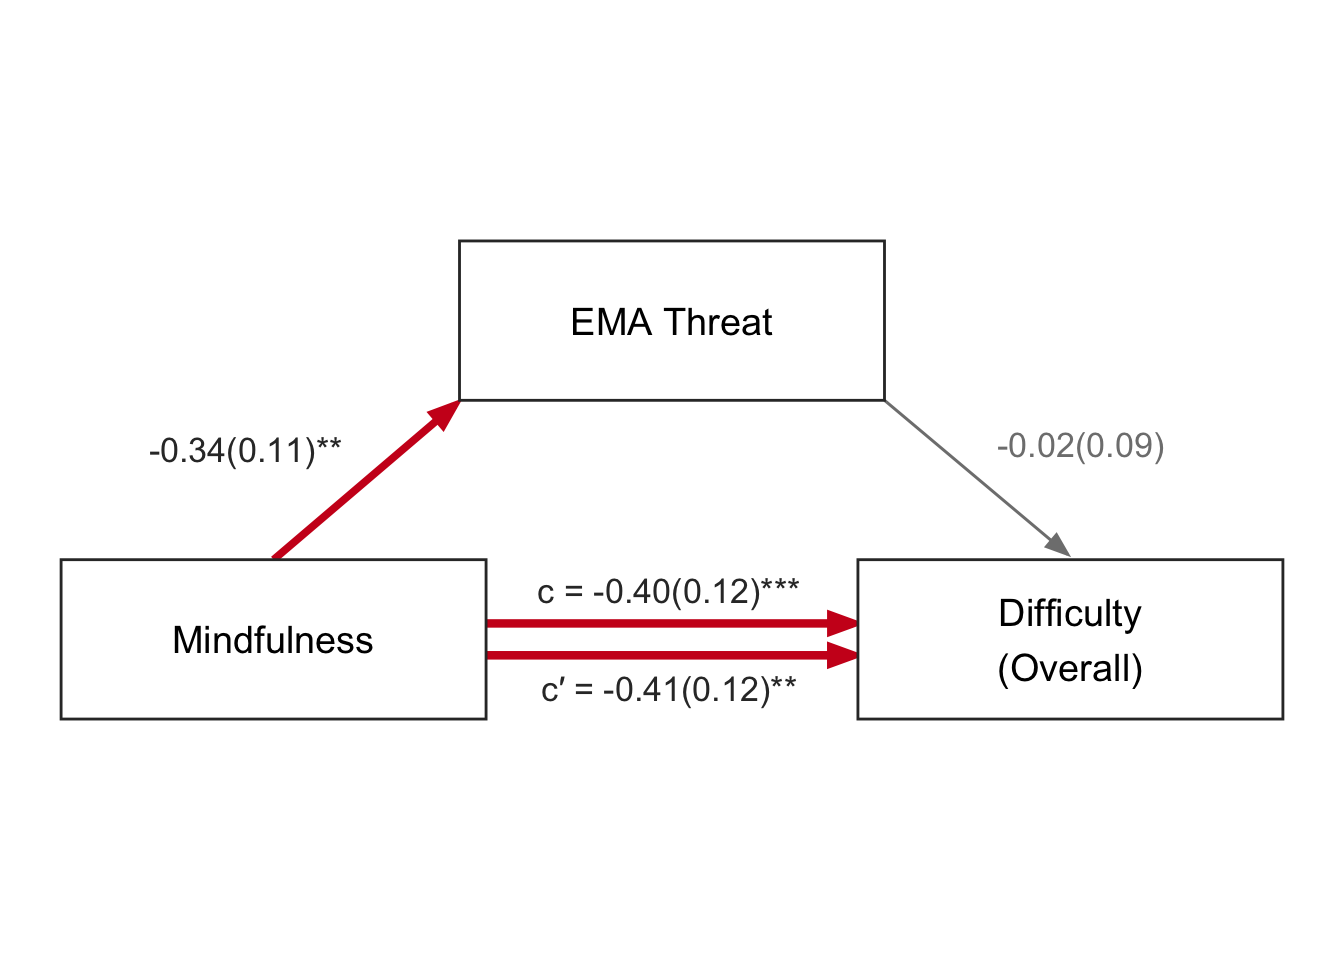
#### Path Diagram
```{r}
#| label: fig-rq2-prereg-8
#| fig-cap: Mediation Analysis for Difficulty at Posttest without Gender Moderation
plot_path_diagram("Difficulty", "no_mod")
```
#### Mediation Test
```{r}
#| label: tbl-med-rq2-prereg-9
#| tbl-cap: Mediation Analysis for Difficulty at Posttest without Gender Moderation
my_mediate_no_mod(perception = "Difficulty") |> kable_mediation()
```